
E-Commerce Consumer Behavior Dashboard
TURNING DATA INTO MEANINGFUL INSIGHTS
This project analyzed e-commerce purchasing behavior to uncover revenue drivers, customer engagement patterns, and geographic sales performance. Using Excel, I transformed a large dataset into an interactive dashboard designed to support data-driven decisions across sales, marketing, inventory planning, and business growth.
Utilizing Excel to Analyze Data
.
Utilizing Excel to Analyze Data .
TOTAL REVENUE
$863,062.05
Revenue generated across all e-commerce purchases analyzed.
TOTAL UNITS SOLD
422,531
Total units purchased during the analyzed time period.
AVERAGE REVENUE PER PURCHASE
$16.70
Average amount spent per order.
AVERAGE BROWSING TIME (SEC)
2,036.30
Average time spent on site per session
01. Monthly Revenue Trends
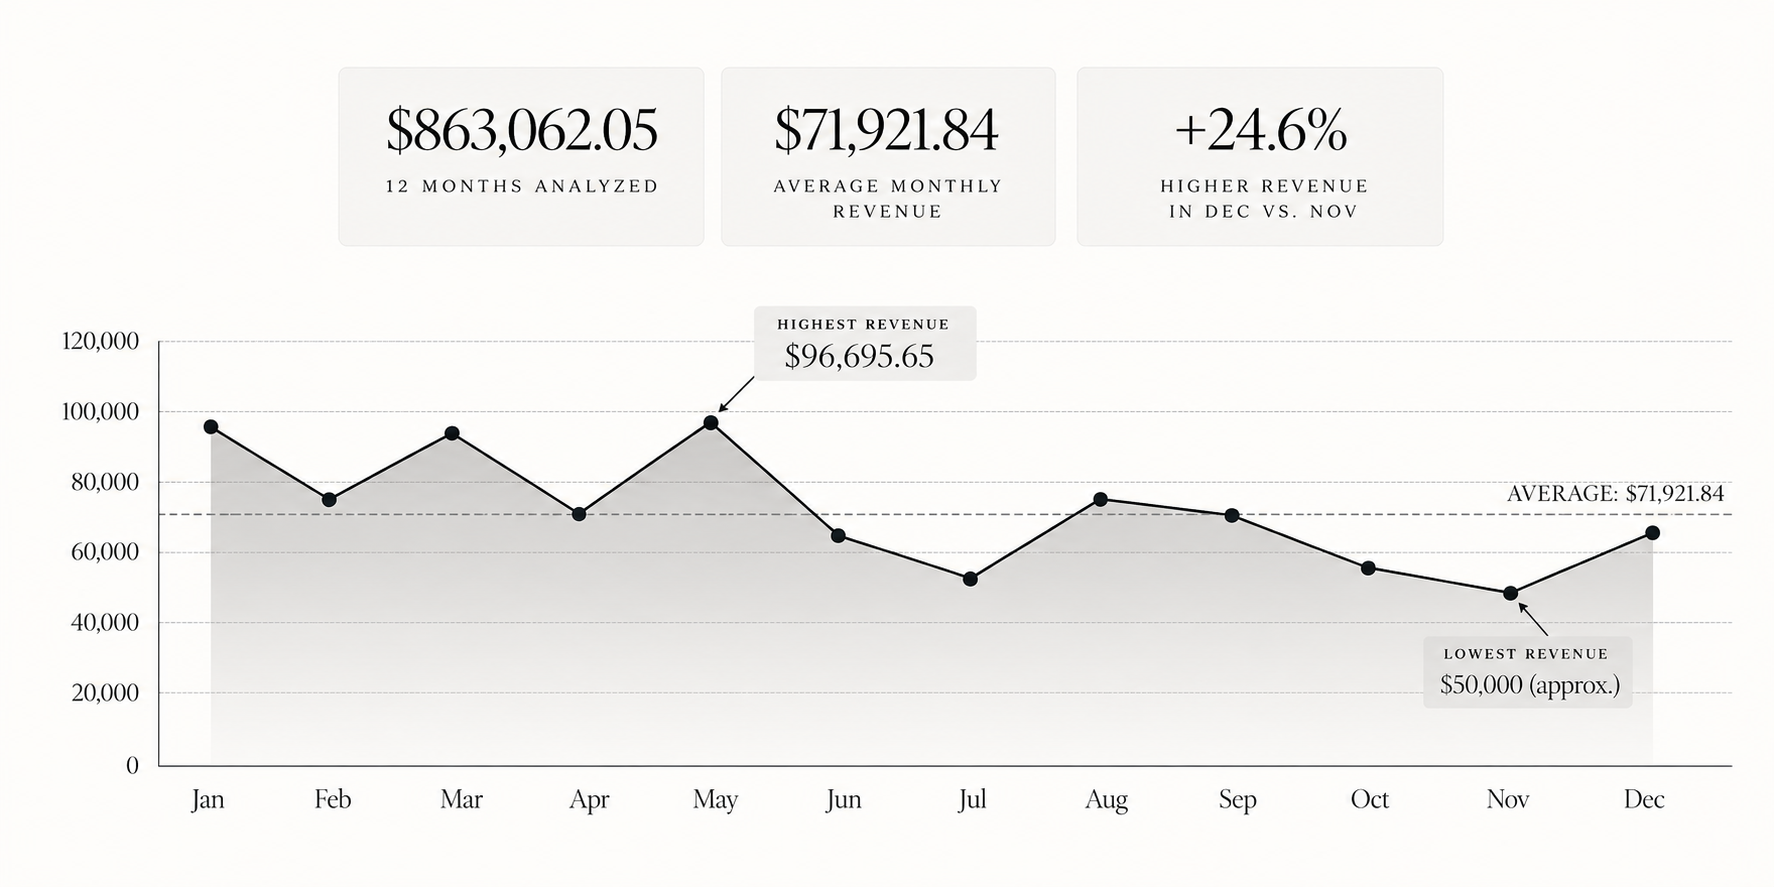
The monthly revenue trend shows fluctuations in purchasing activity throughout the year. This analysis helps identify periods of stronger and weaker performance, allowing for more strategic planning across marketing, inventory, and promotional efforts.
02. Revenue by State
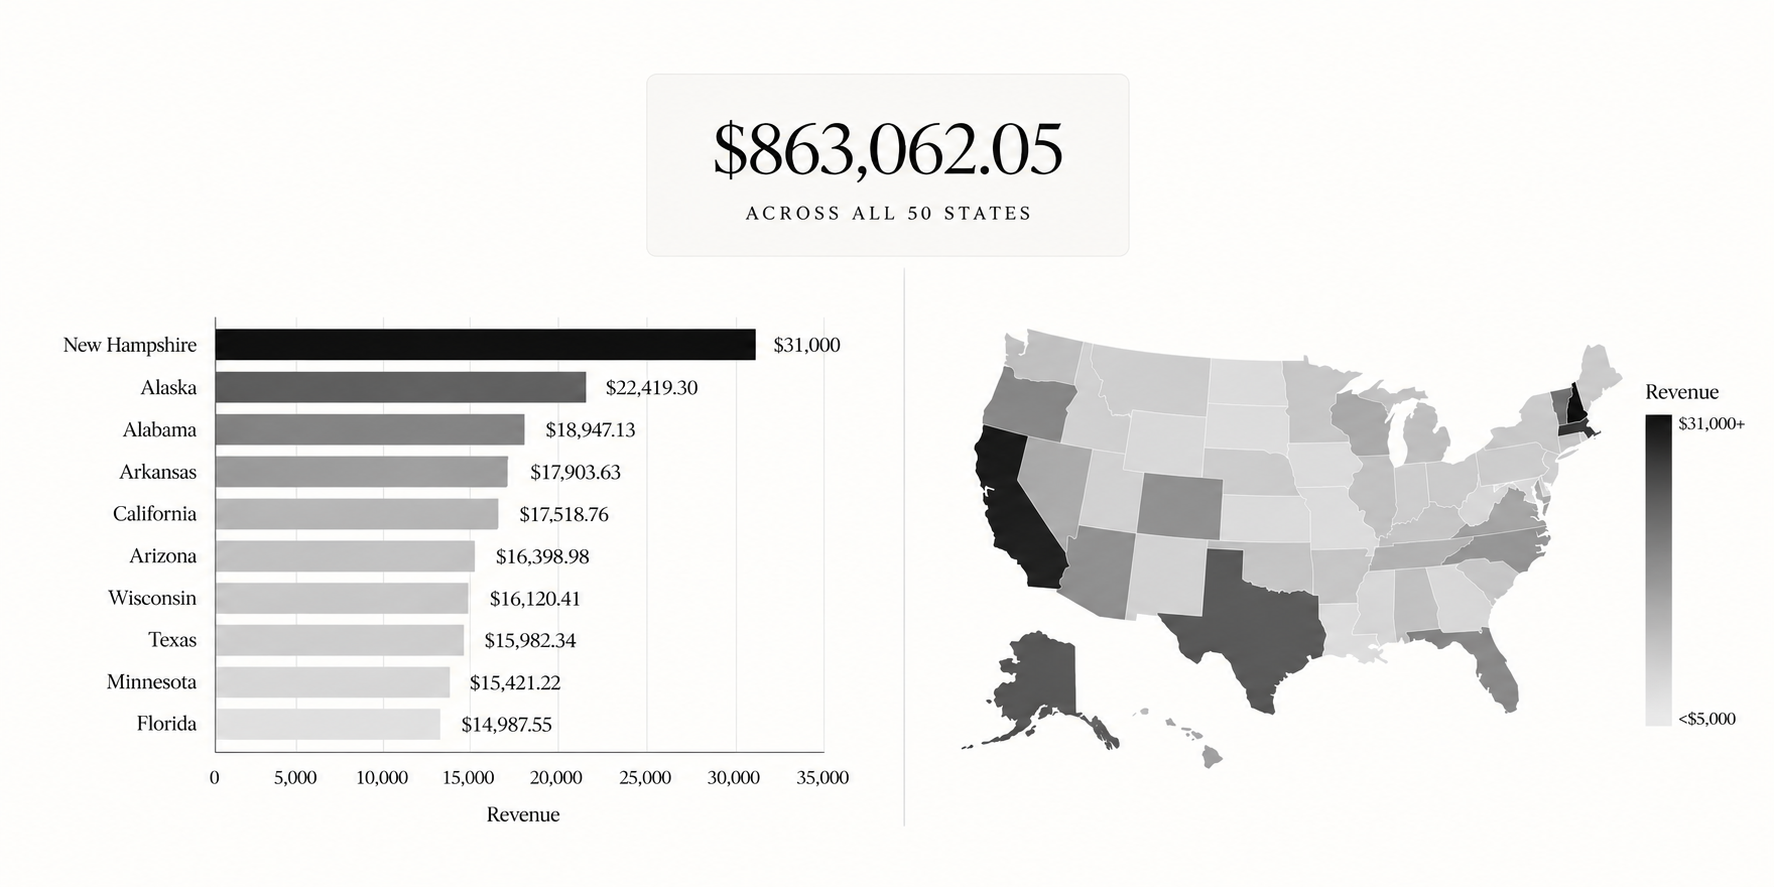
Revenue was analyzed across states to identify geographic differences in sales performance. This provided a clearer view of where customer demand is strongest and can support decisions related to marketing strategies,
03. Revenue Over Time
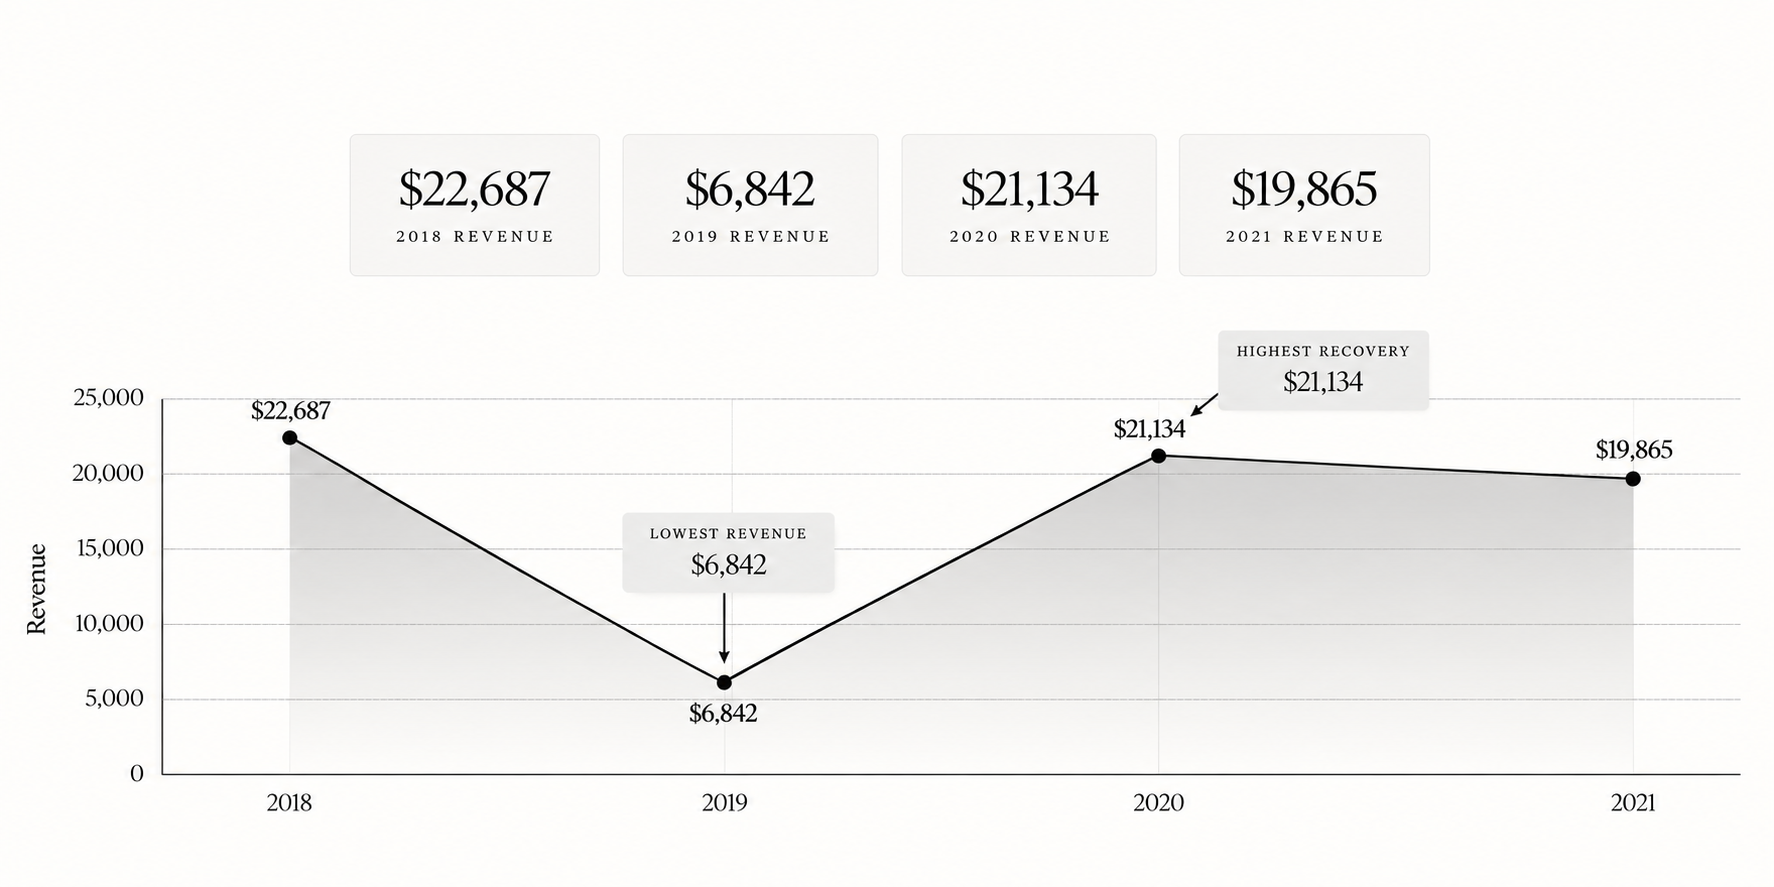
Year-over-year analysis highlights how revenue has changed over time. This helps identify broader trends in customer purchasing behavior and supports long-term strategic planning.
04. Exploring Key Drivers
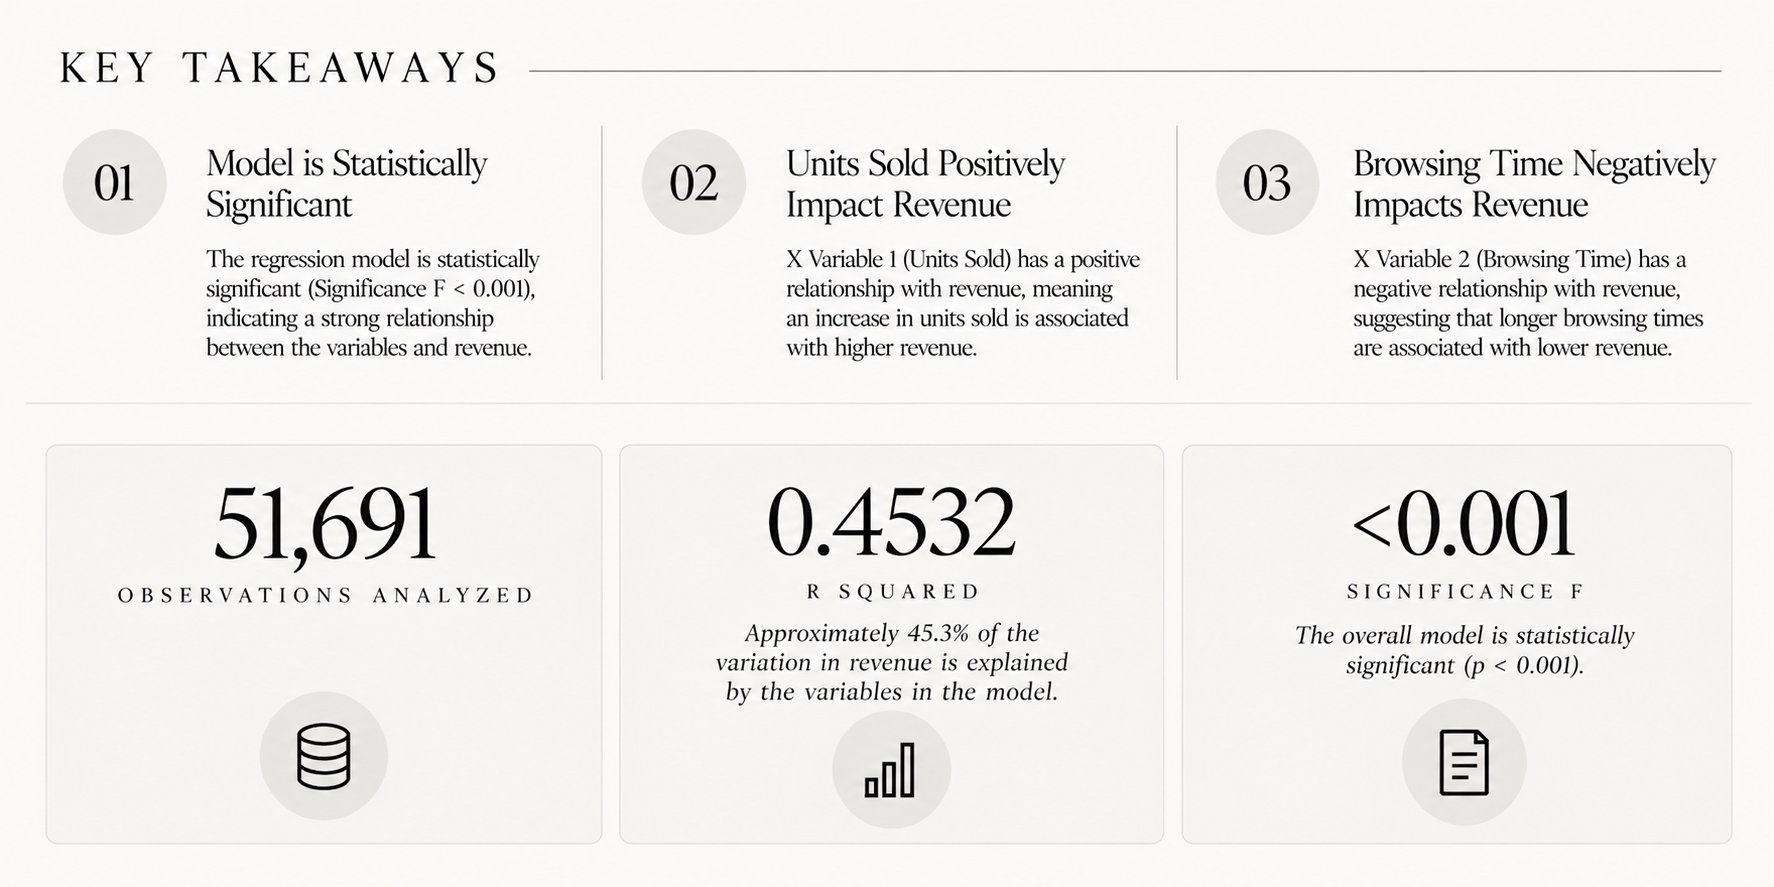
The regression analysis was used to examine relationships within the dataset and better understand the factors associated with performance. This added another layer to the analysis by moving beyond descriptive trends and exploring how key variables influence results.

05. Business Impact
This project strengthened my ability to organize and analyze large datasets, identify meaningful patterns, and translate quantitative information into clear, actionable business insights. By examining revenue trends, geographic performance, customer behavior, and key performance drivers, I developed a stronger understanding of how data can inform strategic decision-making within an e-commerce business. The analysis allowed me to connect performance metrics to broader business priorities, including marketing strategy, inventory planning, customer engagement, and growth opportunities. Ultimately, the project strengthened my ability to approach business decisions analytically and use data to uncover insights that can support more informed, strategic outcomes.